
1. メモ、コメント、画像 表示イメージ |2. メモ・コメント・画像表示方法 |3. タイトルの複数行表示方法
Chart.jp で作成したグラフ上に、メモやコメントおよび画像などを表示する方法について説明します。
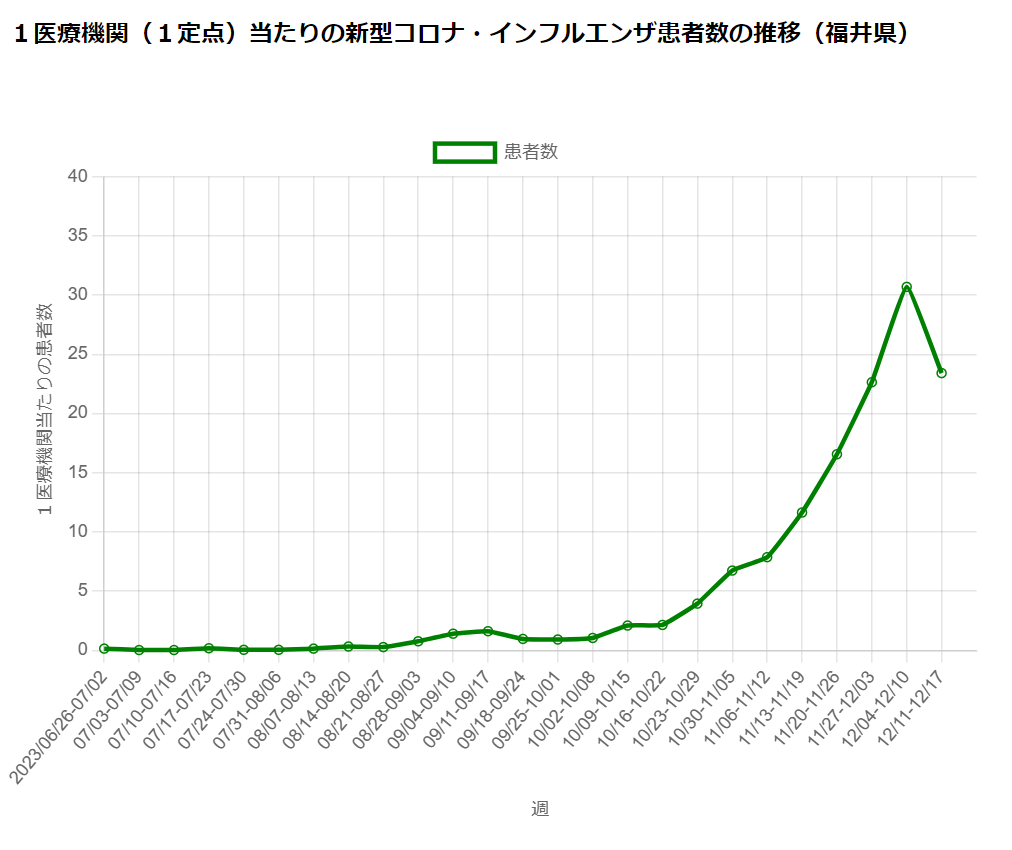
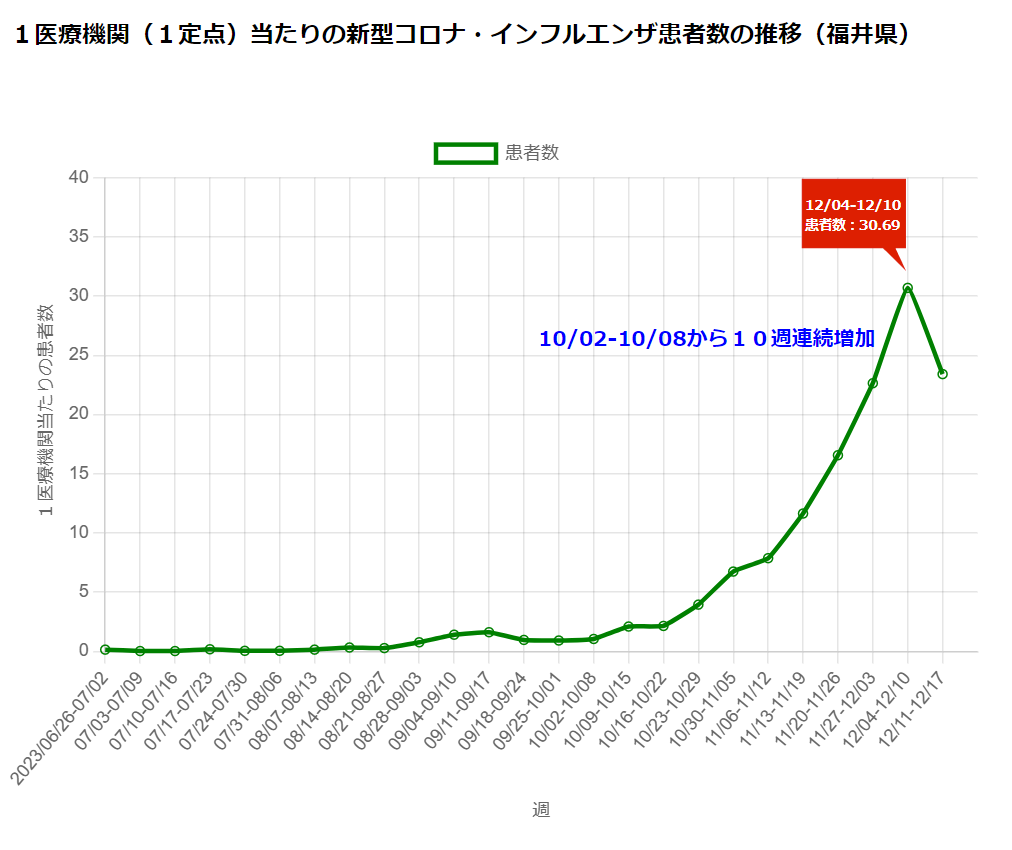
Chart.jpで作成したグラフ上に、メモやメントおよび画像を表示したイメージは下画像のとおりです。
左画像はメモやメントおよび画像を挿入する前のグラフで、
右画像はコメント(注釈文)および画像(吹き出しアイコン)を挿入した後のグラフです。
 メモ、コメント、画像 表示前
|
 メモ、コメント、画像 表示後
|
メモ・コメント・画像表示手順につて以下に説明します。 その手順は、つぎの2通りです。
2-1. 表示メモ・コメント・画像の定義(spanタグ)
spanタグは、グラフ表示域(canvasタグ)と同じ領域(divタグ)内に配置します。
spanタグで定義したデータはつぎのとおりです。
<div style="width:650px;height:500px">
  <!-- グラフ表示域 -->
 <canvas id="Chart0" style="width:650px;height:500px"></canvas>
  <!-- メモ・コメント・画像 定義 3例 -->
  <span id="span1"><img src="./img/sikaku-fukidashi-aka_transparent.png" width="100%">
  </span>
  <span id="span2"><br><br>12/04-12/10<br>患者数:30.69</span>
  <span id="span3">10/02-10/08から10週連続増加</span>
</div>
2-2. 表示メモ・コメント・画像の表示位置および文字属性の定義(CSS)
<style>
#span1 {             /* 吹き出しアイコン画像 */
  position: absolute;
  top: 109px;
  left: 520px;
  width: 100px;
  z-index: -1;  /* Y軸ラベル値の表示を優先にするため、吹き出しアイコン画像の表示を最下位(マイナス値)にする */
}
#span2 {             /* 吹き出しアイコン画像の上に表示する注釈文 */
  position: absolute;
  top: 108px;
  left: 538px;
  font-size: 9px;
  font-weight: bold;
  color: #fff;
}
#span3 {             /* グラフの注釈文 */
  position: absolute;
  top: 220px;
  left: 360px;
  font-size:14px;
  font-weight:bold;
  color:blue;
}
</style>
2-3. まとめ(HTML)
元のHTML(Chart.js Ver4 折れ線グラフ)に、前項「表示メモ・コメント・画像の定義のspanタグおよびCSS」を反映した結果を
完成HTMLに示します。
なお、ここでのサンプルは折れ線グラフですが、棒グラフおよび円グラフにも、同様に適用できます。
<!DOCTYPE html>
<html>
<head>
<meta charset="utf-8" />
<title>1医療機関(1定点)当たりのインフルエンザ患者数の推移(福井県) Chart.js 4.2.1 sample </title>
 <!-- Chart.js Ver4 -->
 <script src="https://cdn.jsdelivr.net/npm/chart.js@4.2.1/dist/chart.umd.min.js"></script>
 <script src="https://cdn.jsdelivr.net/npm/chartjs-adapter-date-fns/dist/chartjs-adapter-date-fns.bundle.min.js"></script>
</head>
<body>
	<p><b>1医療機関(1定点)当たりのインフルエンザ患者数の推移(福井県) </b></p>

	<div style="width:650px;height:500px">
		<canvas id="myChart" style="width:650px;height:500px"></canvas>
	</div>

	<script>
		let	ctx = document.getElementById( "myChart" );
		let chart = new Chart( ctx,
			{
				type: 'line',
				data: {
					labels: [
       '2023/06/26-07/02', '07/03-07/09','07/10-07/16', '07/17-07/23', '07/24-07/30',
             '07/31-08/06', '08/07-08/13', '08/14-08/20','08/21-08/27','08/28-09/03',
             '09/04-09/10','09/11-09/17','09/18-09/24','09/25-10/01','10/02-10/08',
             '10/09-10/15','10/16-10/22','10/23-10/29','10/30-11/05','11/06-11/12',
             '11/13-11/19','11/20-11/26', '11/27-12/03','12/04-12/10','12/11-12/17',,    //23.41人
							 ],
					datasets: [
						{
						label: '患者数',
                                                        data:[0.15,0.03,0.03,0.18,0.05,
                                                              0.05,0.15,0.33,0.28,0.77,
                                                              1.41,1.62,0.97,0.92,1.05,
                                                              2.10,2.15,3.95,6.74,7.87,
                                                              11.64,16.56,22.64,30.69,23.41,  //50週 12/11-12/17
                                                ],
                                                        borderColor: "green",       //"rgba( 255, 0, 0, 1 )",
							backgroundColor: "rgba( 0, 0, 0, 0 )",
							lineTension: 0.1,	//曲線の度合
						},
					],
				},
				options: {
					animation: false,
					plugins: {	//
						title: {
							display: true,
							text: '',        // '"g" now'
                                                        fontSize: 20,
						}	//
					},
					scales: {
						y: {	//yAxes: [{
							suggestedMax: 40,	//
							suggestedMin: 0,	//
							ticks: {
								//suggestedMax: 11,
								//suggestedMin: -1,
								//stepSize: 1,
								//callback: function(value, index, values){
								//	return  value +  ' g'
								//}
							},
							title: {	//scaleLabel: {
								display: true,
								text: ' 1医療機関当たりの患者数'	//labelString: ' gravitational acceleration [g]'
							}
						},
						x: {	//xAxes: [{
							title: {	//scaleLabel: {
								display: true,
								text: '週'	//labelString: 'time'
							}
						}
					},
				}
			}
		);
	</script>
</body>
</html>
<!DOCTYPE html>
<html>
<head>
<meta charset="utf-8" />
<title>1医療機関(1定点)当たりのインフルエンザ患者数の推移(福井県) Chart.js 4.2.1 sample </title>
 <!-- Chart.js Ver4 -->
 <script src="https://cdn.jsdelivr.net/npm/chart.js@4.2.1/dist/chart.umd.min.js"></script>
 <script src="https://cdn.jsdelivr.net/npm/chartjs-adapter-date-fns/dist/chartjs-adapter-date-fns.bundle.min.js"></script>

<!-- 表示メモ・コメント・画像の表示位置の定義(CSS)-->
<style>
#span1 {
  position: absolute;
  top: 111px;
  left: 520px;
  width: 100px;
  z-index: -1;
}
#span2 {
  position: absolute;
  top: 111px;
  left: 538px;
  font-size: 9px;
  font-weight: bold;
  color: #fff;
}
#span3 {
  position: absolute;
  top: 218px;
  left: 350px;
  font-size:14px;
  font-weight:bold;
  color:blue;
}
</style>

</head>
<body>
	<p><b>1医療機関(1定点)当たりのインフルエンザ患者数の推移(福井県) </b></p>

	<div style="width:650px;height:500px">
		<canvas id="myChart" style="width:650px;height:500px"></canvas>
                <span id="span1"><img src="./img/sikaku-fukidashi-aka_transparent.png" width="100%"></span>
                <span id="span2"><br><br>12/04-12/10<br>患者数:30.69</span>
                <span id="span3">10/02-10/08から10週連続増加</span>
	</div>

	<script>
		let	ctx = document.getElementById( "myChart" );
		let chart = new Chart( ctx,
			{
				type: 'line',
				data: {
					labels: [
       '2023/06/26-07/02', '07/03-07/09','07/10-07/16', '07/17-07/23', '07/24-07/30',
             '07/31-08/06', '08/07-08/13', '08/14-08/20','08/21-08/27','08/28-09/03',
             '09/04-09/10','09/11-09/17','09/18-09/24','09/25-10/01','10/02-10/08',
             '10/09-10/15','10/16-10/22','10/23-10/29','10/30-11/05','11/06-11/12',
             '11/13-11/19','11/20-11/26', '11/27-12/03','12/04-12/10','12/11-12/17',,    //23.41人
							 ],
					datasets: [
						{
						label: '患者数',
                                                        data:[0.15,0.03,0.03,0.18,0.05,
                                                              0.05,0.15,0.33,0.28,0.77,
                                                              1.41,1.62,0.97,0.92,1.05,
                                                              2.10,2.15,3.95,6.74,7.87,
                                                              11.64,16.56,22.64,30.69,23.41,  //50週 12/11-12/17
                                                ],
                                                        borderColor: "green",       //"rgba( 255, 0, 0, 1 )",
							backgroundColor: "rgba( 0, 0, 0, 0 )",
							lineTension: 0.1,	//曲線の度合
						},
					],
				},
				options: {
					animation: false,
					plugins: {	//
						title: {
							display: true,
							text: '',        // '"g" now'
                                                        fontSize: 20,
						}	//
					},
					scales: {
						y: {	//yAxes: [{
							suggestedMax: 40,	//
							suggestedMin: 0,	//
							ticks: {
								//suggestedMax: 11,
								//suggestedMin: -1,
								//stepSize: 1,
								//callback: function(value, index, values){
								//	return  value +  ' g'
								//}
							},
							title: {	//scaleLabel: {
								display: true,
								text: ' 1医療機関当たりの患者数'	//labelString: ' gravitational acceleration [g]'
							}
						},
						x: {	//xAxes: [{
							title: {	//scaleLabel: {
								display: true,
								text: '週'	//labelString: 'time'
							}
						}
					},
				}
			}
		);
	</script>
</body>
</html>
<!DOCTYPE html>
<html>
<head>
<meta charset="utf-8" />
<title>1医療機関(1定点)当たりのインフルエンザ患者数の推移(福井県) Chart.js 4.2.1 sample </title>
 <!-- Chart.js 4 -->
 <script src="https://cdn.jsdelivr.net/npm/chart.js@4.2.1/dist/chart.umd.min.js"></script>
 <script src="https://cdn.jsdelivr.net/npm/chartjs-adapter-date-fns/dist/chartjs-adapter-date-fns.bundle.min.js"></script>

<!-- 表示メモ・コメント・画像の属性定義CSS -->
<style>
#span1 {
  position: absolute;
  top: 75px;
  left: 520px;
  width: 100px;
  z-index:-1;
}
#span2 {
  position: absolute;
  top: 75px;
  left: 538px;
  font-size: 9px;
  font-weight: bold;
  color: #fff;
}

#span3 {
  position: absolute;
  top: 304px;
  left: 310px;
  width: 100px;
  z-index: -1;
}
#span4 {
  position: absolute;
  top: 304px;
  left: 330px;
  font-size: 9px;
  font-weight: bold;
  color: #fff;
}

#span5 {
  position: absolute;
  top: 167px;
  left: 280px;
  width: 300px;
  z-index: -1;
}
#span6 {
  position: absolute;
  top: 196px;
  left: 332px;
  font-size:14px;
  font-weight:bold;
  color: blue;
  z-index: -1;
}
</style>

</head>
<body>
<div style="width:650px;height:500px">
 <canvas id="myChart" style="width:650px;height:500px"></canvas>
 <span id="span1"><img src="./img/sikaku-fukidashi-aka_transparent.png" width="100%" id="img1"></span>
 <span id="span2"><br><br>12/04-12/10<br>患者数:30.69</span> <!-- span1に表示する文字-->
 <span id="span3"><img src="./img/sikaku-fukidashi-B.webp" width="100%" id="img2"></span>
 <span id="span4"><br><br>10/02-10/08<br>患者数:1.05</span> <!-- span3に表示する文字-->
 <span id="span5"><img src="./img/長方形-bf45ad6cbfc6d0febb355cc42112aef3.png" width="100%" id="img3"></span>
 <span id="span6">10/02-10/08から10週連続増加</span> <!-- span5に表示する文字-->
</div>

<!-- chartjs 起動 -->
<script>
		let	ctx = document.getElementById( "myChart" );
		let chart = new Chart( ctx,
			{
				type: 'line',
				data: {
					labels: [
                                           '2023/06/26-07/02', '07/03-07/09','07/10-07/16', '07/17-07/23', '07/24-07/30',
                                            '07/31-08/06', '08/07-08/13', '08/14-08/20','08/21-08/27','08/28-09/03',
                                            '09/04-09/10','09/11-09/17','09/18-09/24','09/25-10/01','10/02-10/08',
                                            '10/09-10/15','10/16-10/22','10/23-10/29','10/30-11/05','11/06-11/12',
                                            '11/13-11/19','11/20-11/26', '11/27-12/03','12/04-12/10','12/11-12/17',,    //23.41人
							 ],
					datasets: [
						{
						label: '患者数',
                                                        data:[0.15,0.03,0.03,0.18,0.05,
                                                              0.05,0.15,0.33,0.28,0.77,
                                                              1.41,1.62,0.97,0.92,1.05,
                                                              2.10,2.15,3.95,6.74,7.87,
                                                              11.64,16.56,22.64,30.69,23.41,  //50週 12/11-12/17
                                                ],
                                                        borderColor: "green",       //"rgba( 255, 0, 0, 1 )",
							backgroundColor: "rgba( 0, 0, 0, 0 )",
							lineTension: 0.1,	//曲線の度合
						},
					],
				},
				options: {
					animation: false,
					plugins: {	//
						title: {
							display: true,
							text: '1医療機関(1定点)当たりのインフルエンザ患者数の推移(福井県)',
                                                          font: { size: 18, },
                                                          color: "blue",
						}	//
					},
					scales: {
						y: {	//yAxes: [{
							suggestedMax: 40,	//
							suggestedMin: 0,	//
							ticks: {
								//suggestedMax: 11,
								//suggestedMin: -1,
								//stepSize: 1,
								//callback: function(value, index, values){
								//	return  value +  ' g'
								//}
							},
							title: {	//scaleLabel: {
								display: true,
								text: ' 1医療機関当たりの患者数'	//labelString: ' gravitational acceleration [g]'
							}
						},
						x: {	//xAxes: [{
							title: {	//scaleLabel: {
								display: true,
								text: '週'	//labelString: 'time'
							}
						}
					},
				}
			}
		);
</script>

</body>
</html>
タイトルの複数行および空白行の表示手順につて以下に説明します。
以下は、タイトルを2行に表示する例です。複数行を表示したい場合は、text文を配列で指定します。
var chart = new Chart(ctx, {
    type: 'line',
    data: data,
    options: {
        title: {
            display: true,
            text: ['1行目タイトル', '2行目タイトル']   //text文を配列で指定
        }
    }
})
以下に、タイトルの複数行表示のHTMLおよびそのデモを示します。
<!DOCTYPE html>
<html lang="en">
<head>
    <meta charset="UTF-8">
    <!-- Chart.js -->
    <script src="https://cdnjs.cloudflare.com/ajax/libs/Chart.js/2.7.2/Chart.bundle.min.js"></script>
    <!-- ラベル関係プラグインjs -->
    <script src="js/labeling-plugin.js"></script>
    <title>RSウイルス患者の1医療機関(定点)当たり報告数(静岡県)</title>
</head>
<body>
 <!--ここにグラフが挿入されます-->
 <div style="width: 640px; height:500px" id="fukidasi1">
    <canvas style="width: 640px; height:500px" id="myLineChart"></canvas><!-- sikaku-fukidashi-aka_transparent fukidashi119-red.png -->
 </div>

<script>
  //グラフ描写
  //Chartクラス
  var ctxline = document.getElementById("myLineChart");  //.getContext("2d");
  var myLineChart = new Chart(ctxline, {
    //グラフの種類
     type: 'line',

    //データの設定
    data: {
      // 3 データ項目のラベル
      labels: ['2024/01/01-01/07','01/08-01/14',
             '01/15-01/21', '01/22-01/28', '01/29-02/04', '02/05-02/11', '02/12-02/18',
             '02/19-02/25', '02/26-03/03', '03/04-03/10', '03/11-03/17', '03/18-03/24',
             '03/25-03/31', '04/01-04/07', '04/08-04/14', '04/15-04/21',,,  //2024-16週
             ],

      //データセット
      datasets: [
          {
              //凡例
              label: "RSウイルス",
              //面の表示
              fill: false,
              //線のカーブ
              lineTension: 0,
              //背景色
              backgroundColor: "blue",
              //枠線の色
              borderColor: "blue",
              //結合点の枠線の色
              pointBorderColor: "blue",
              //結合点の背景色
              pointBackgroundColor: "#fff",
              //結合点のサイズ
              pointRadius: 3,
              //結合点のサイズ(ホバーしたとき)
              pointHoverRadius: 3,
              //結合点の背景色(ホバーしたとき)
              pointHoverBackgroundColor: "blue",
              //結合点の枠線の色(ホバーしたとき)
              pointHoverBorderColor: "blue",
              //結合点より外でマウスホバーを認識する範囲(ピクセル単位)
              pointHitRadius: 10,
              //グラフのデータ データのない場合は、NaN を指定する  https://www3.nhk.or.jp/news/special/infection/dashboard/shizuoka_rs-virus.html
              data:[0.02,0,0.04,0.03,0.03,
                    0.02,0.04,0.06,0.12,0.17,
                    0.21,0.25,0.44,0.73,0.90,
                    1.64,   //2024-16週  1.64
                   ]
            },
      ]
    },

 //オプション
   options: {
	     //responsive: true,
             title: {
                 display: true,
                 fontSize: 16,
                 text: ['RSウイルス患者の1医療機関(定点)当たり報告数(静岡県)' , '2024/01/01-01/07(1週)~ 2024/04/15-04/21(16週)']
                   },
             scales: {
               yAxes: [
                  {
                    display: true,                //表示設定
                    scaleLabel: {                 //軸ラベル設定
                       display: true,             //表示設定
                       labelString: '感染者数(人)',  //ラベル
                       fontSize: 12               //フォントサイズ
                    },
                    ticks: {
                       beginAtZero: true,
                       max: 2,
                       min: 0,
                       //stepSize: 5,
                       fontSize: 12             //フォントサイズ
                    },
                 },
               ],
               xAxes: [{                         //x軸設定
                    display: true,                //表示設定
                    scaleLabel: {                 //軸ラベル設定
                       display: true,             //表示設定
                       labelString: '週',  //ラベル
                       fontSize: 12               //フォントサイズ
                    },
                    ticks: {
                        autoSkip: false,
                        //maxTicksLimit: 6,
                        fontSize: 12             //フォントサイズ
                    },
                }],
		tooltips: {
			mode: 'point',
			intersect: true,
				},

              },

   },
     plugins:[DataLabelPluginB],  //データラベルプラグイン起動
});
</script>
</body>
</html>
1. メモ、コメント、画像 表示イメージ |2. メモ・コメント・画像表示方法 |3. タイトルの複数行表示方法 |TOP
chart.js関連サイト内リンク

最終更新日: 2023.12.26(Debut),2024. 4.28 |
|
|
|